

Xdebug
Every PHP version Flock installs ships with Xdebug. Loading Xdebug slows down every request, so Flock runs a second PHP pool with Xdebug loaded and sends it only the requests that ask to be debugged. Everything else stays at full speed.
Turning it on
Switch on Xdebug in the Flock panel, or Detect Xdebug requests in Settings → Debugger.
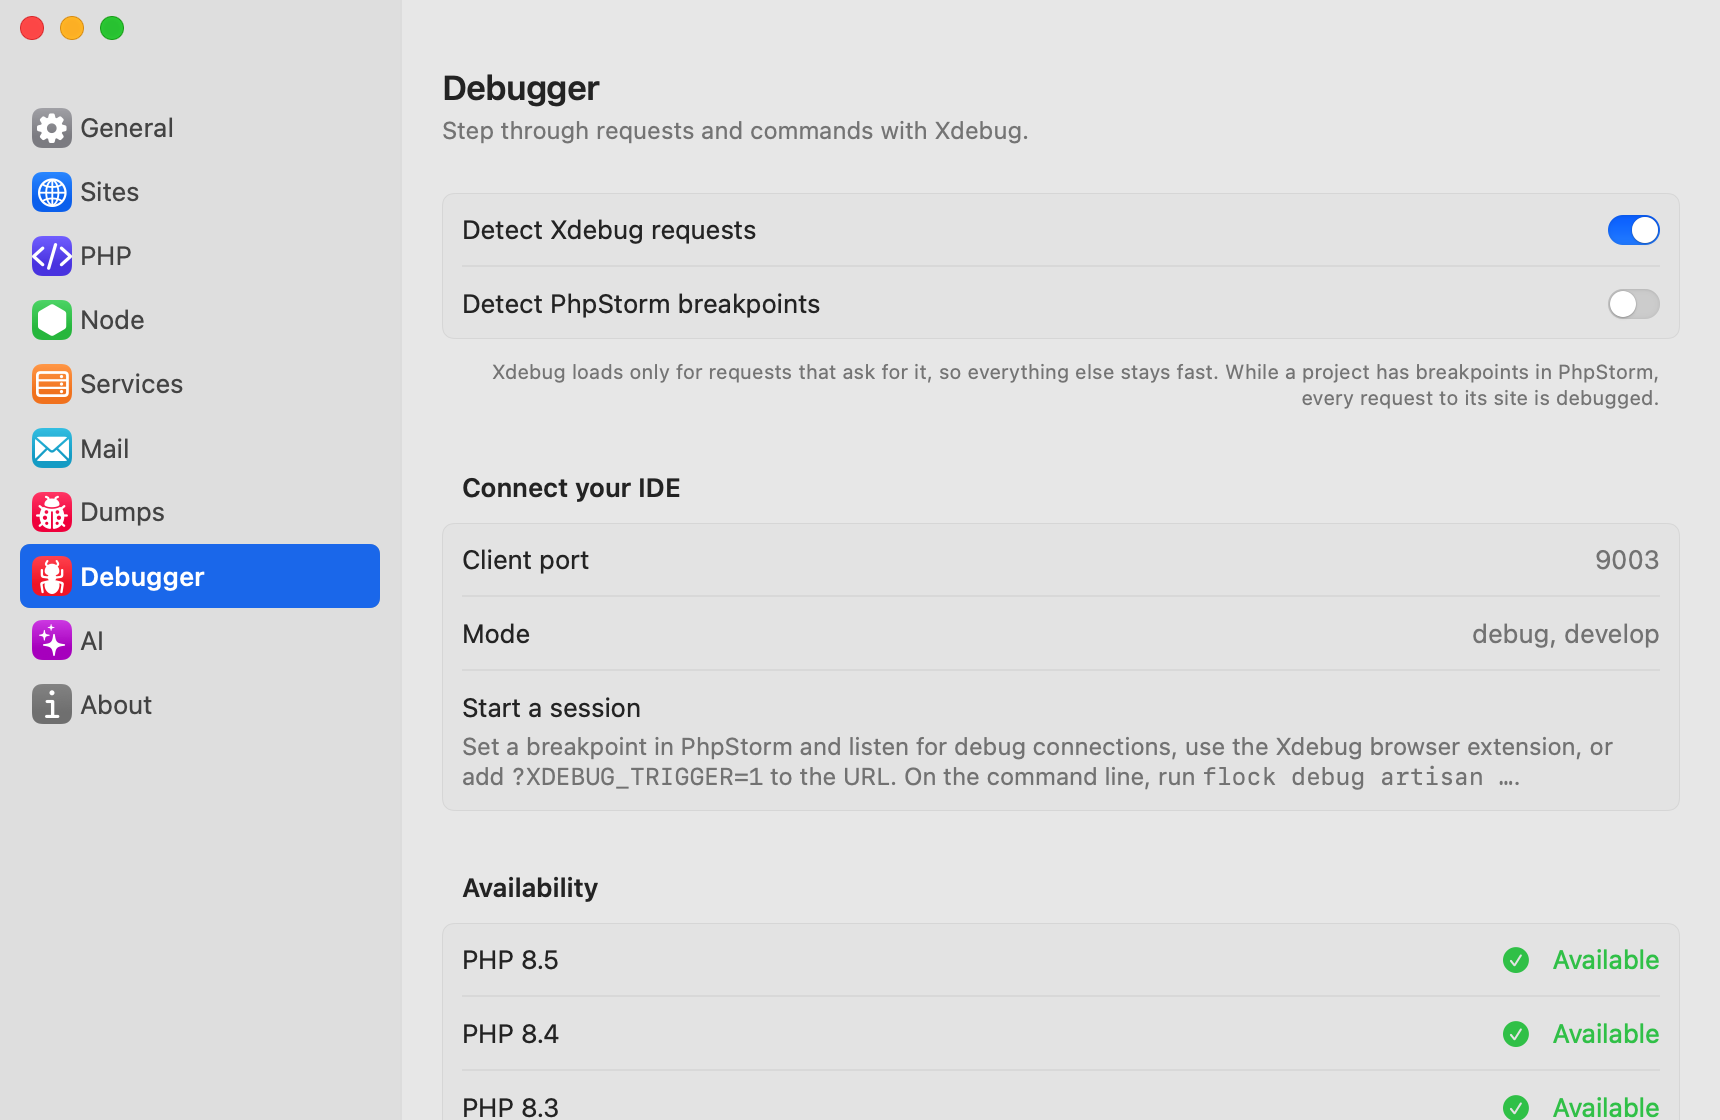
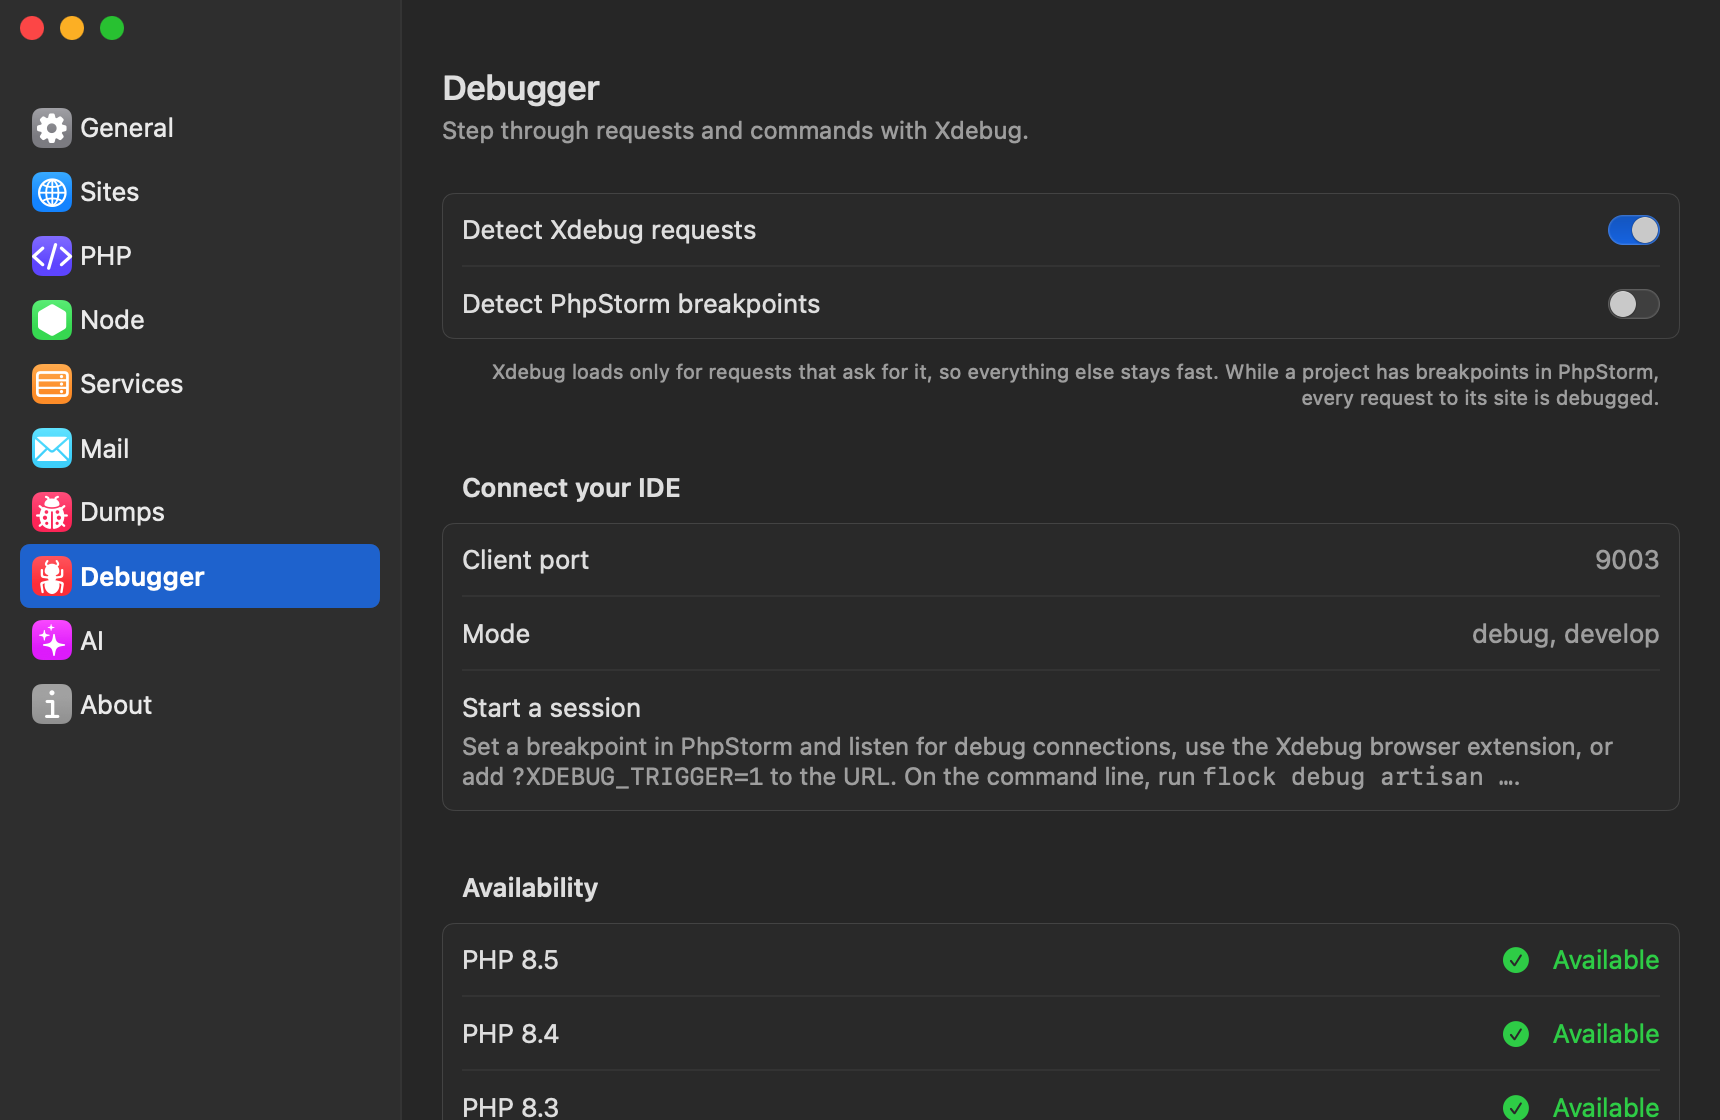
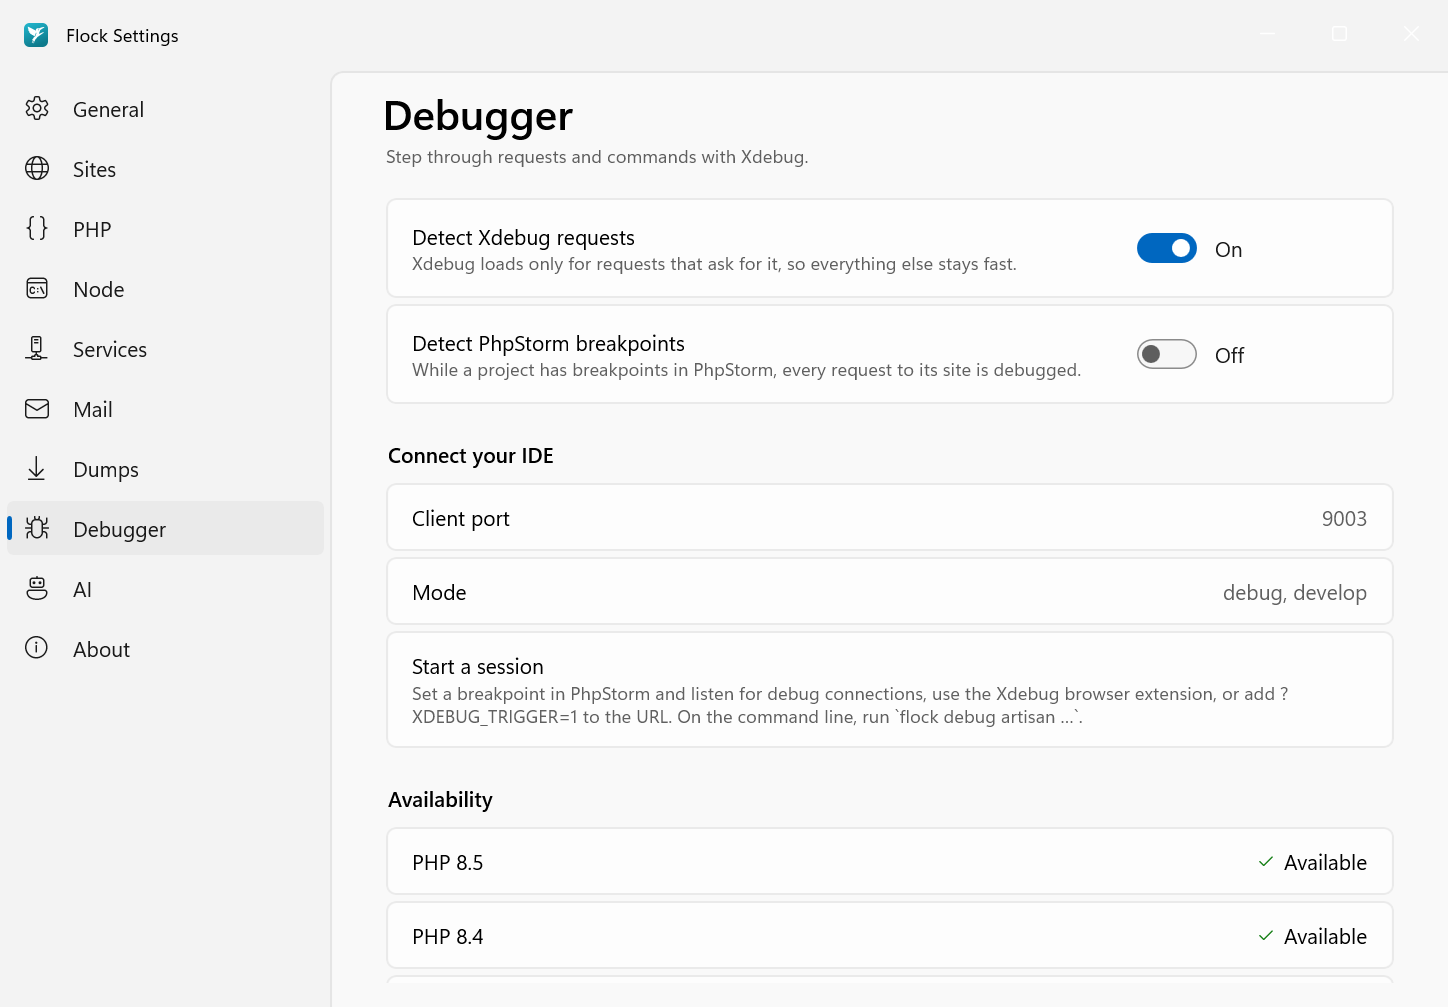
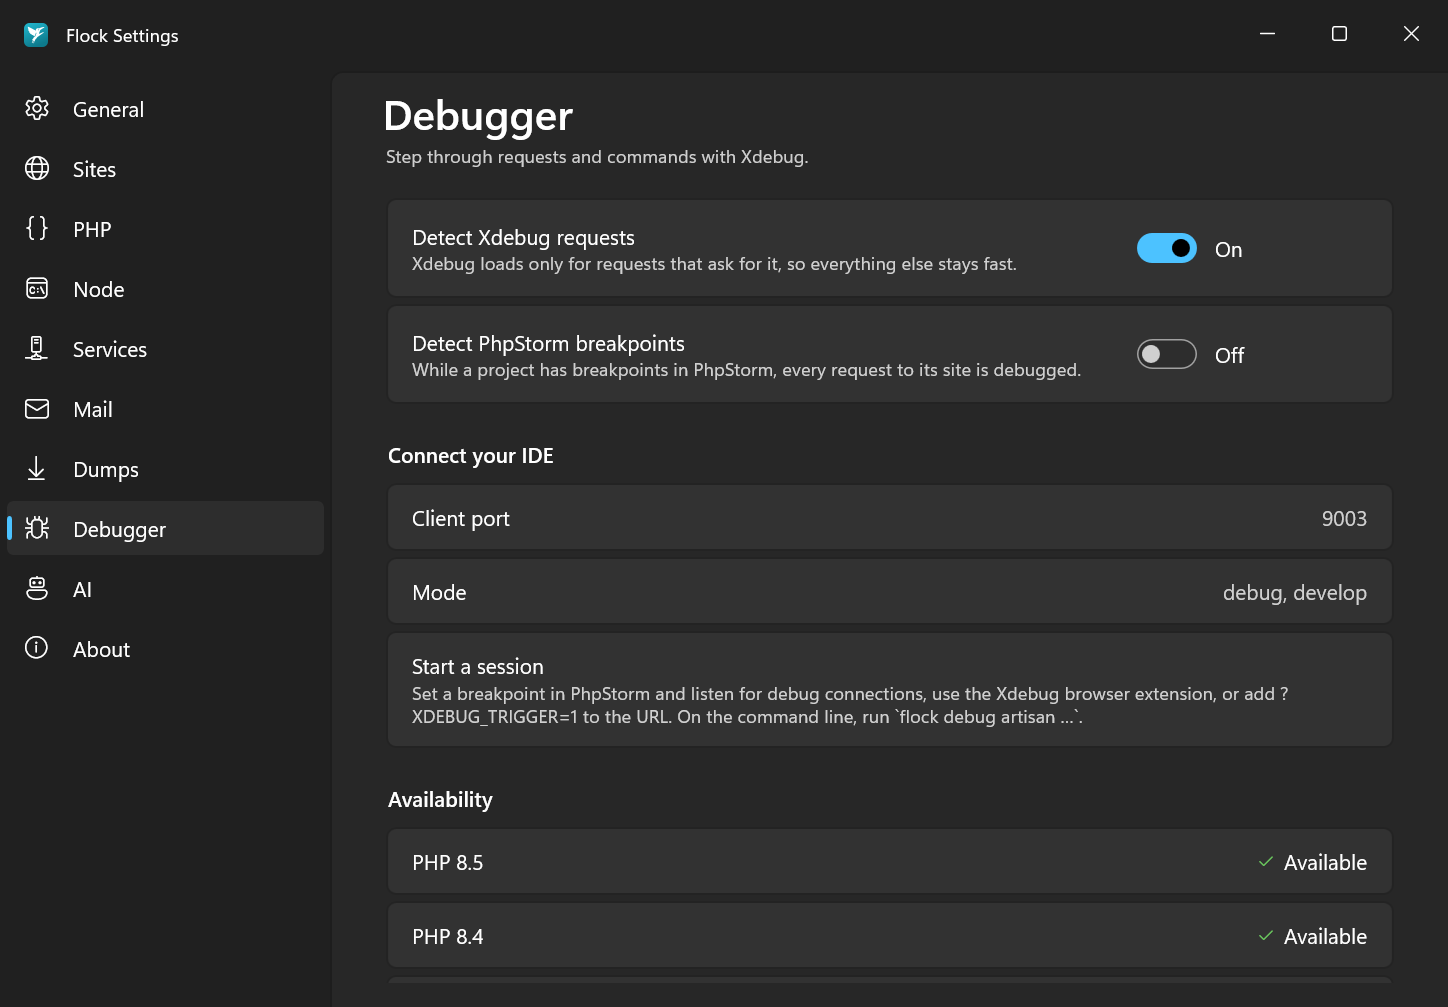
The Availability section of the Debugger pane lists which of your PHP versions include Xdebug.
flock xdebug on
flock xdebug off
flock xdebug        # show the current state
The setting applies to all PHP versions.
Starting a debug session
While Xdebug is on, a request goes to the Xdebug pool when:
- it comes from an Xdebug helper extension in your browser,
- its URL has
XDEBUG_TRIGGER=1, for examplehttps://acme.test/checkout?XDEBUG_TRIGGER=1, - or it's for a site with breakpoints set in PhpStorm, if you turn that on.
PhpStorm breakpoints
With this on, every request of a site that has breakpoints in PhpStorm (in the project's .idea/workspace.xml) is debugged, without an extension or trigger.
Switch on Detect PhpStorm breakpoints in Settings → Debugger. While a site is being debugged, it shows a bug icon in the Flock panel.
flock xdebug breakpoints on
Artisan commands and tests
To debug something on the command line, run it through flock debug. It uses the project's PHP version with Xdebug loaded, and works even while Xdebug detection is off:
flock debug artisan app:sync-orders
flock debug vendor/bin/phpunit
flock debug composer install
Editor setup
In PhpStorm or VS Code (with the PHP Debug extension), listen for connections on port 9003. No path mappings are needed, because Flock runs PHP directly from your project folder.
Settings → Debugger shows the client port and mode under Connect your IDE.